即将开播:5月20日,基于kubernetes打造企业级私有云实践
介绍
当从事机器学习项目时,所有数据科学家都必须面对的一个问题是:哪种机器学习模型架构比较适合我的数据呢?

不幸的是,对于哪种模型比较好,还没有明确的答案。当面对这种不确定性的时候,常用的方法是:实验!
在本文中,我将向您展示如何快速测试数据集上的多个模型,以找到可能提供优质性能的机器学习模型,从而使您能够将精力集中在模型的微调和优化上。
机器学习数据集
在开始实验之前,我们需要一个数据集。我将假设我们的问题是有监督的二元分类任务。让我们从sklearn加载乳腺癌数据集开始。
- from sklearn.datasets import load_breast_cancer
- X, y = data = load_breast_cancer(return_X_y=True)
接下来,我们需要将数据拆分为训练集和测试集。拆分比例为75/25。
- from sklearn.model_selection import train_test_split
- X_train, X_test, y_train, y_test = train_test_split(X, y, test_size=0.25, random_state=8675309)
Python编码
我们将在此数据集上快速测试6种不同模型的拟合度。
- 逻辑回归
- 随机森林
- K最近邻居
- 支持向量机
- 高斯朴素贝叶斯
- XGBoost
为了更准确地表示每个模型的拟合度,实际上是需要调整默认参数的,但是,本文出于演示目的,我将使用每个模型的默认参数,这样可以使总体思路更加清晰。
- from sklearn.linear_model import LogisticRegression
- from sklearn.neighbors import KNeighborsClassifier
- from sklearn.svm import SVC
- from sklearn.ensemble import RandomForestClassifier
- from sklearn.naive_bayes import GaussianNB
- from xgboost import XGBClassifier
- from sklearn import model_selection
- from sklearn.utils import class_weight
- from sklearn.metrics import classification_report
- from sklearn.metrics import confusion_matrix
- import numpy as np
- import pandas as pd
- def run_exps(X_train: pd.DataFrame , y_train: pd.DataFrame, X_test: pd.DataFrame, y_test: pd.DataFrame) -> pd.DataFrame:
- '''
- Lightweight script to test many models and find winners
- :param X_train: training split
- :param y_train: training target vector
- :param X_test: test split
- :param y_test: test target vector
- :return: DataFrame of predictions
- '''
- dfs = []
- models = [
- ('LogReg', LogisticRegression()),
- ('RF', RandomForestClassifier()),
- ('KNN', KNeighborsClassifier()),
- ('SVM', SVC()),
- ('GNB', GaussianNB()),
- ('XGB', XGBClassifier())
- ]
- results = []
- names = []
- scoring = ['accuracy', 'precision_weighted', 'recall_weighted', 'f1_weighted', 'roc_auc']
- target_names = ['malignant', 'benign']
- for name, model in models:
- kfold = model_selection.KFold(n_splits=5, shuffle=True, random_state=90210)
- cv_results = model_selection.cross_validate(model, X_train, y_train, cv=kfold, scoring=scoring)
- clf = model.fit(X_train, y_train)
- y_pred = clf.predict(X_test)
- print(name)
- print(classification_report(y_test, y_pred, target_names=target_names))
- results.append(cv_results)
- names.append(name)
- this_df = pd.DataFrame(cv_results)
- this_df['model'] = name
- dfs.append(this_df)
- final = pd.concat(dfs, ignore_index=True)
- return final
- final=run_exps(X_train,y_train, X_test, y_test )
- final
在上面的Python代码中有很多东西需要解释。首先,我们创建一个变量dfs,该变量用来保存通过对训练集上应用5-fold交叉验证创建的数据集。
接下来,models保存在元组列表中,其中包含要测试的每个分类器的名称和类。在此之后,我们循环遍历这个列表并运行5-fold交叉验证。每次运行的结果都记录在我们附加到dfs列表的pandas dataframe中。必须注意,这里指标是两个类的加权平均指标。
测试集上的分类报告如下:
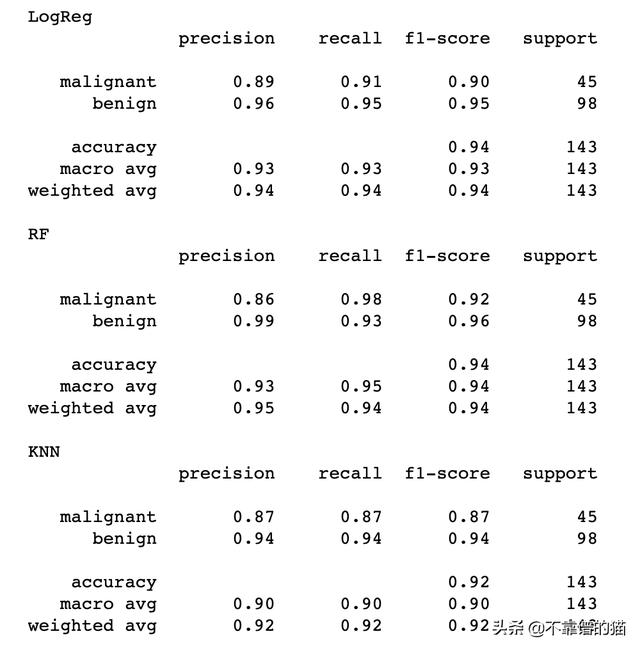
评估结果
我们将分析从run_exps()脚本返回的final(dataframe)中的数据。
为了更好地估计每个模型的指标分布,我在30个样本上运行了empirical bootstrapping。此外,我将关注两个指标:性能指标和拟合时间指标。下面的Python代码块实现了这一点。
- bootstraps = []
- for model in list(set(final.model.values)):
- model_df = final.loc[final.model == model]
- bootstrap = model_df.sample(n=30, replace=True)
- bootstraps.append(bootstrap)
- bootstrap_df = pd.concat(bootstraps, ignore_index=True)
- results_long = pd.melt(bootstrap_df,id_vars=['model'],var_name='metrics', value_name='values')
- time_metrics = ['fit_time','score_time'] # fit time metrics
- ## PERFORMANCE METRICS
- results_long_nofit = results_long.loc[~results_long['metrics'].isin(time_metrics)] # get df without fit data
- results_long_nofit = results_long_nofit.sort_values(by='values')
- ## TIME METRICS
- results_long_fit = results_long.loc[results_long['metrics'].isin(time_metrics)] # df with fit data
- results_long_fit = results_long_fit.sort_values(by='values')
首先,让我们绘制来自5-fold交叉验证的性能指标。
- import matplotlib.pyplot as plt
- import seaborn as sns
- plt.figure(figsize=(20, 12))
- sns.set(font_scale=2.5)
- g = sns.boxplot(x="model", y="values", hue="metrics", data=results_long_nofit, palette="Set3")
- plt.legend(bbox_to_anchor=(1.05, 1), loc=2, borderaxespad=0.)
- plt.title('Comparison of Model by Classification Metric')
- #plt.savefig('./benchmark_models_performance.png',dpi=300)
- plt.show()
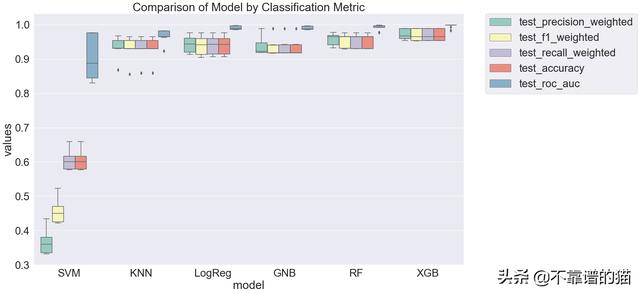
很明显,支持向量机在所有指标上对我们的数据的拟合度都很差,而集成决策树模型(Random Forest和XGBoost)对数据的拟合非常好。
训练时间怎么样呢?
- plt.figure(figsize=(20, 12))
- sns.set(font_scale=2.5)
- g = sns.boxplot(x="model", y="values", hue="metrics", data=results_long_fit, palette="Set3")
- plt.legend(bbox_to_anchor=(1.05, 1), loc=2, borderaxespad=0.)
- plt.title('Comparison of Model by Fit and Score Time')
- plt.show()
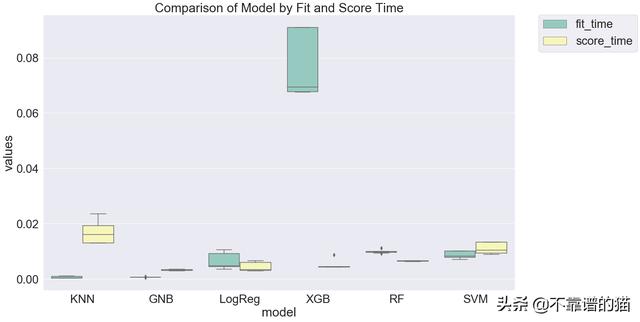
随机森林虽然相对于KNN、GNB和LogReg来说比较慢,但其性能仅次于KNN。如果我继续细化模型,我可能会将大部分精力集中在随机森林上,因为它的性能几乎与XGBoost相同(它们的95%置信区间可能重叠),但训练速度几乎快了4倍!
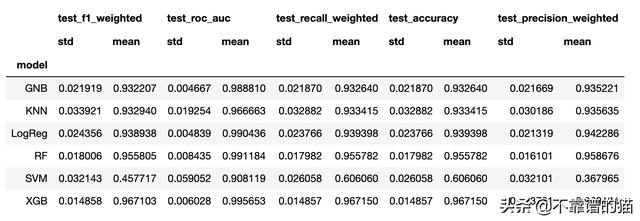
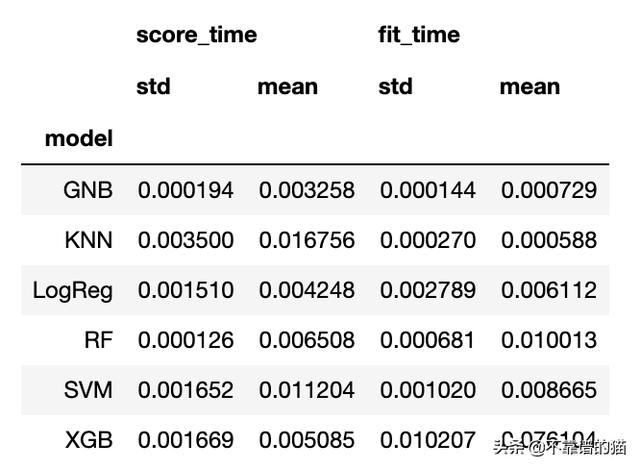
如果您希望对这些模型进行更多的分析(例如,计算每个度量标准的置信区间),您将需要访问每个度量标准的均值和标准差。
- metrics = list(set(results_long_nofit.metrics.values))
- bootstrap_df.groupby(['model'])[metrics].agg([np.std, np.mean])
- time_metrics = list(set(results_long_fit.metrics.values))
- bootstrap_df.groupby(['model'])[time_metrics].agg([np.std, np.mean])
结论
上述分析只考虑了平均精度、召回率等。在实际问题中,您不太可能关心类之间的平均精度,相反,您可能会特别关注某个类的精度!此外,必须调整每个机器学习模型的超参数,以真正评估它们与数据的拟合程度。
作者:不靠谱的猫_今日头条
原文链接:https://www.toutiao.com/i6827007470188102148/
转载请注明:www.ainoob.cn » 快速比较多种机器学习模型实例